How good does it look, and how sure can you be?
The Strata Score rates a strategy from 0 to 100 the way an allocator reviews a systematic program. Quality says how good the record looks. Evidence says how much of that to believe. Here is exactly what goes into both, with the weights and the curves. The tests behind them are described in the methodology.
The formula
Points above 50 are earned in proportion to the evidence. Thin evidence never lifts a weak strategy, and with full evidence an excellent one can reach 100. Evidence multiplies because nothing else stops a brilliant-looking result on a few dozen out-of-sample trades from taking the top grade.
Quality: five pillars
Fixed-capital daily Sharpe, Sortino, MAR (annual growth divided by maximum drawdown) and profit factor. All four are ratios, so trading more contracts does not buy a higher score.
Sharpe on the reserved period, how much of the training Sharpe it kept, and its profit factor. This is the period the search and the tuning never saw.
Whether profit survives nearby parameter settings, reruns with one and two extra ticks of slippage and 50% and 100% more commission, and eight reruns on prices nudged by a tick or two.
Maximum drawdown measured in years of profit, the bad tail of 2,000 block-bootstrap paths (the weakest of 1-, 5- and 20-day blocks counts), and expected shortfall against daily volatility.
Share of profitable months, profitable windows out of six, profit that remains without the best five trades, and how straight the equity curve is.
When prop-firm evaluation is on, a sixth pillar, account survival, takes 20% and the others are trimmed to 20, 20, 15, 15 and 10. A measure that cannot be computed earns zero; it is never replaced with an optimistic default.
Evidence: three factors
The weaker of two t-statistics: daily returns with autocorrelation-robust errors, and per-trade results. A sparse strategy's daily series is mostly zeros, which flatters the first, so the second can bind.
z of 1.645 earns 50% · 2.326 earns 70% · 3 earns 85%
Closed trades across training and the reserved period.
100 trades earn 65% · 200 earn 85% · 600 earn full credit
Trades in the reserved out-of-sample period.
30 trades earn 50% · 100 earn 85% · 300 earn full credit
The three are combined as a geometric mean, so none can stand in for another: a thousand training trades do not make up for ten on the reserved period.
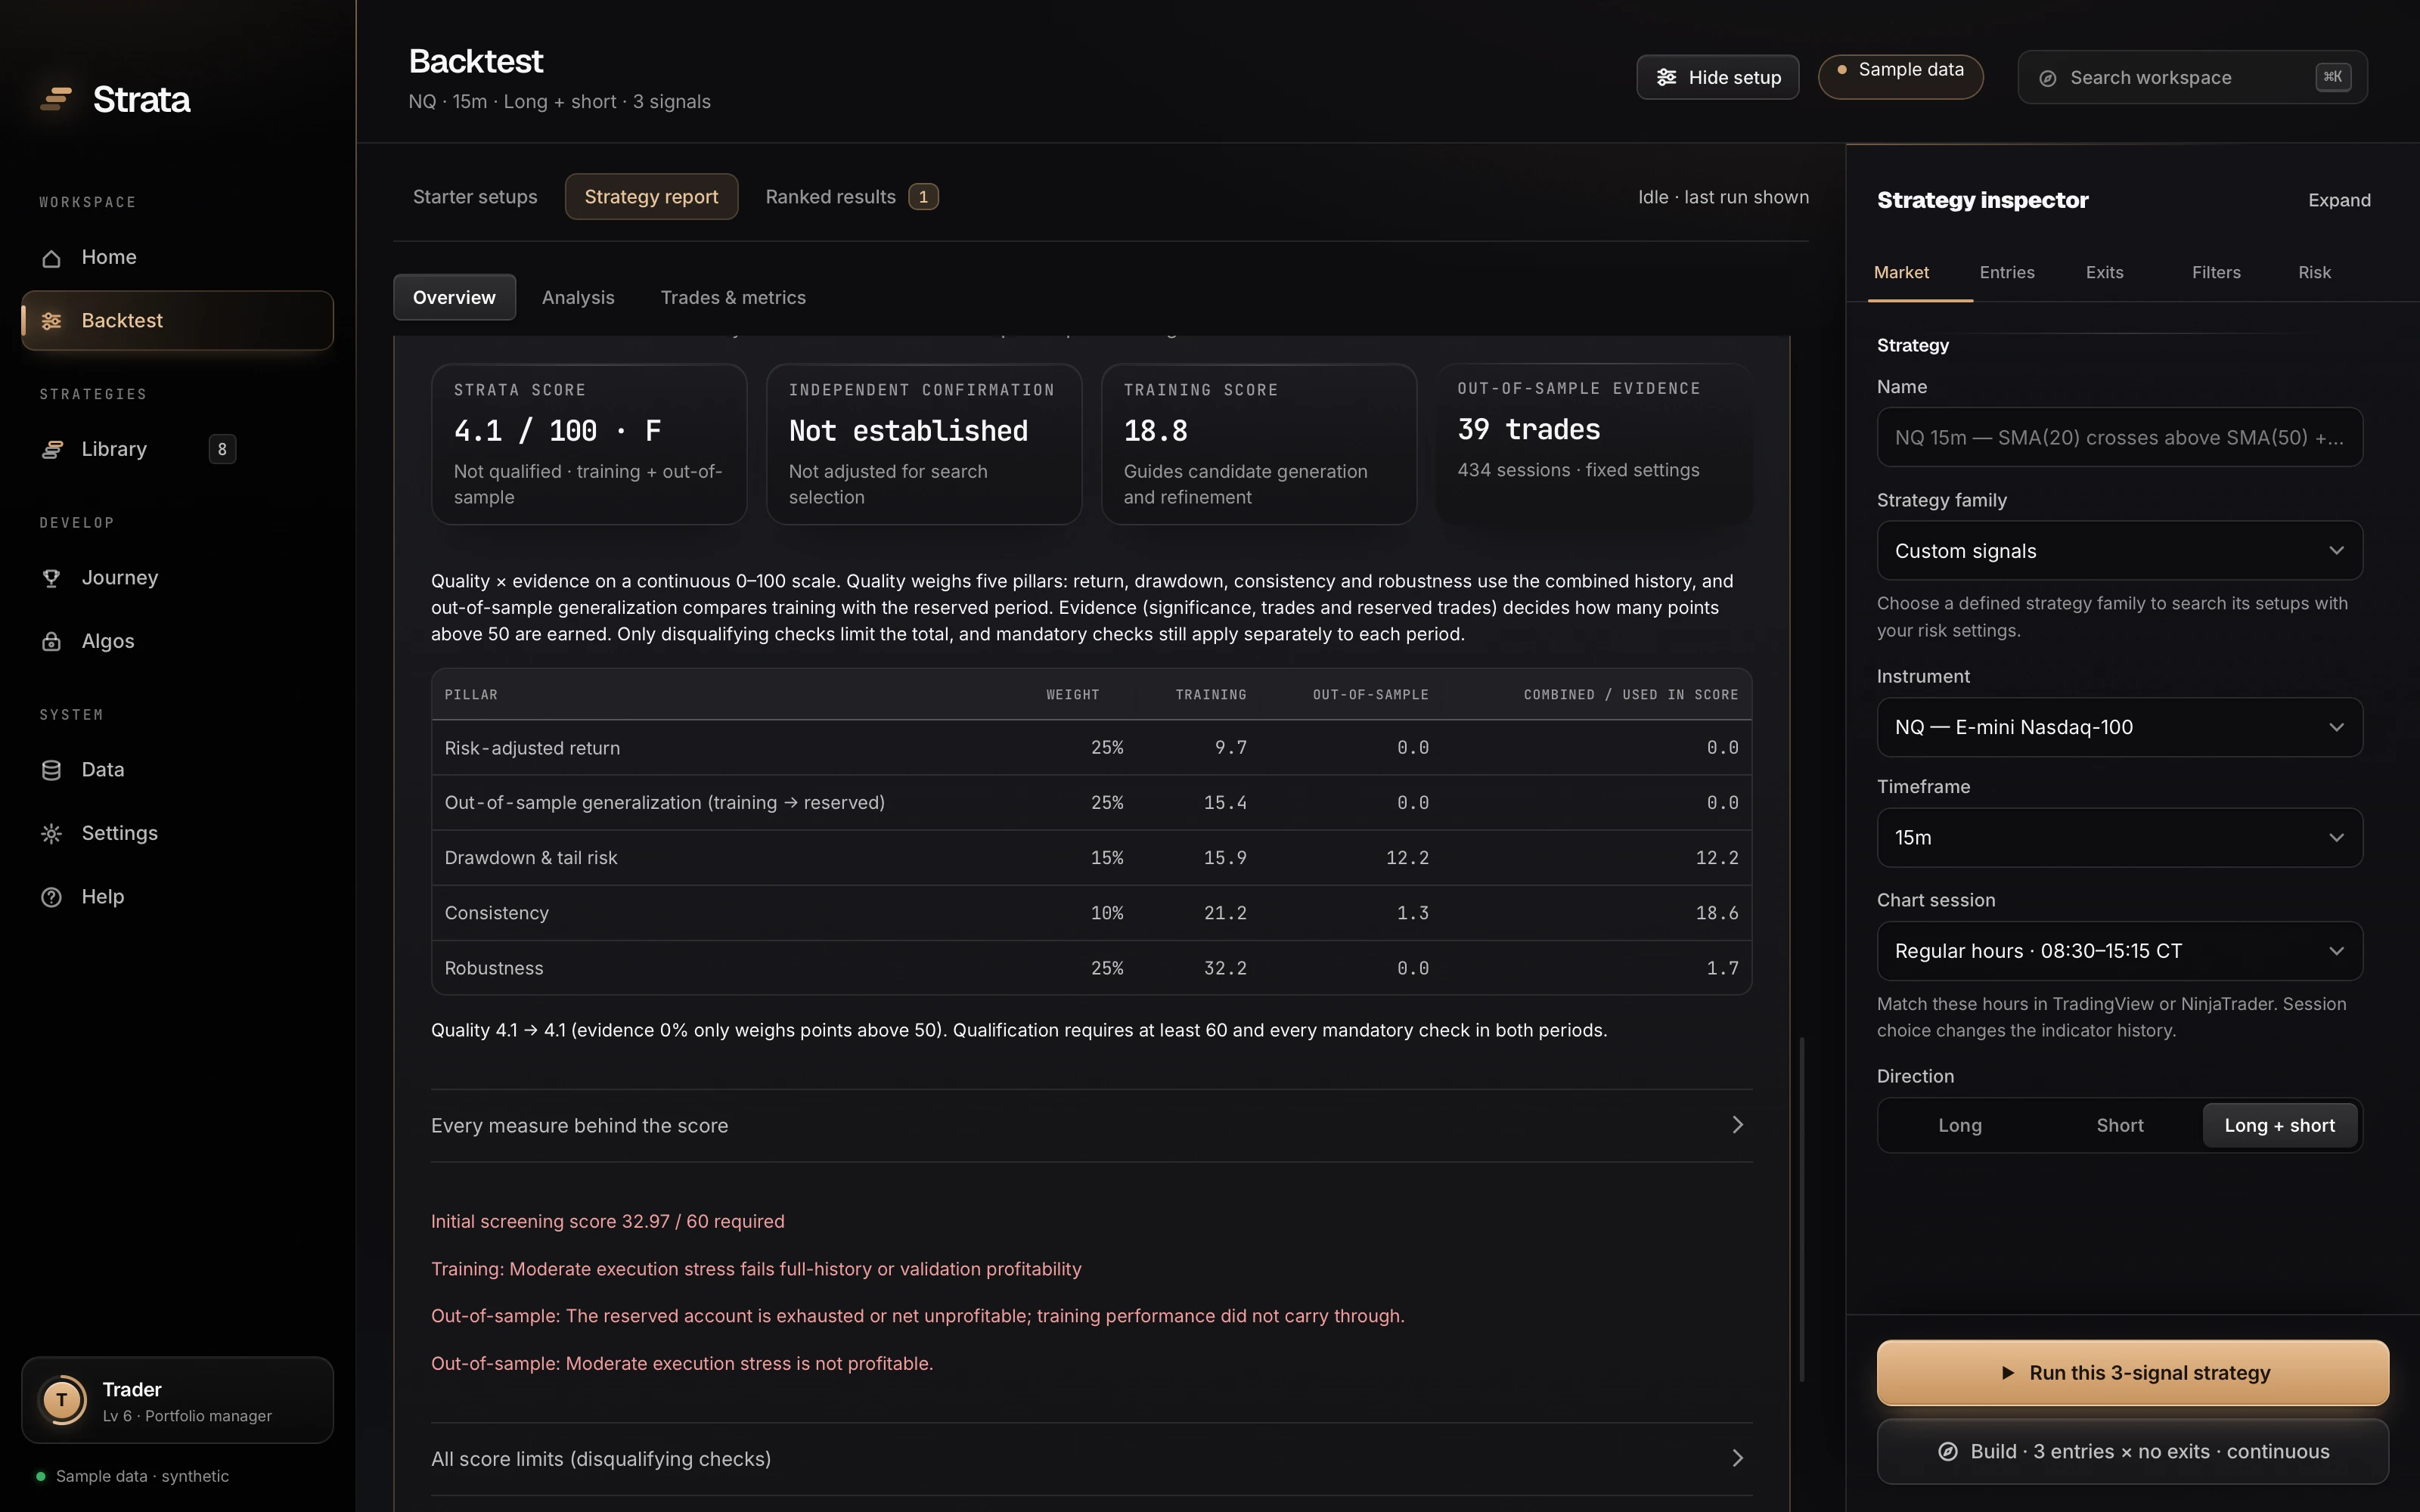
The breakdown in a real report, here on synthetic sample data: each pillar with its weight and its points on training, out-of-sample and combined. With no edge to find, the total is 4.1, an F.
Published curves
Every measure earns points on a fixed curve, interpolated between anchors. A few of them:
The report’s “Every measure behind the score” lists all of them with the value and the points each one earned. The curves are Strata’s product policy, set from allocator conventions. They are not fitted to future returns.
The only limits
There are no ceilings for missing a nice-to-have. Only disqualifying results cap a score:
| Capped at | When |
|---|---|
| 34 | The account was exhausted, or the strategy lost money overall or in the reserved period. |
| 49 | The validation period was unprofitable, or the strategy failed the moderate cost stress (one extra tick, 50% more commission). |
| 59 | Any mandatory qualification check failed: trade counts, sessions, same-bar exits, trading frequency, prop rules or incomplete tests. |
| 64 | The result is provisional: a fast first pass before the full robustness suite has run. |
A strategy qualifies with a score of 60 or more and every mandatory check passed in both periods, including at least 30 trades and 63 sessions in the reserved period. A score just under 60 never rounds up.
Grades
| Score | Grade | How to read it |
|---|---|---|
| 90–100 | A+ | Top quality on deep evidence. Roughly: quality above 93 with 400+ trades, 150+ of them out of sample. Deliberately rare. |
| 82–89 | A | Strong on every pillar with enough trades to trust it. |
| 74–81 | B+ | Solid, with a weaker pillar worth reading in the breakdown. |
| 65–73 | B | Promising. Check the evidence before sizing. |
| 50–64 | C | Marginal quality, thin evidence, or a failed qualification check. |
| 35–49 | D | Fragile. Weak quality, or a validation or cost check failed. |
| Below 35 | F | Unprofitable overall or on unseen data, or very weak quality. |
For calibration: the seven NQ starters that ship with the app score between 68.4 and 81.4. In one live search of about 30,000 Initial Balance variants on ES, the best survivors scored 84 to 87.
What the score is not
It is not a probability. An 80 does not mean an 80% chance of profit. It is a rating of how a strategy behaved under historical stress, and nothing about markets promises the future will resemble the past.
It does not correct for how hard you searched. The best of ten thousand candidates is flattered by having been picked. The deflated Sharpe ratio and the probability of backtest overfitting are reported separately, beside the score, for exactly that reason.
It is not independent confirmation. Once you choose between strategies by their out-of-sample results, that period has been used. The app flags it, and fresh data is the only real cure.
It is not for sale. Every strategy is scored by the same code on your own machine, including the starters we ship.
Futures and derivatives carry substantial risk. Backtest results do not guarantee future returns. Strata is software, not investment advice.